How to Draw a Genogram — Standard Symbols and the Three-Generation Rule
A genogram is a clinical tool that maps a family's composition, relationships, and major events across at least three generations on a single page, using agreed-upon symbols. It grew out of Murray Bowen's family systems theory in 1978 and became a standard assessment tool in family therapy and counseling after Monica McGoldrick and Randy Gerson systematized its symbols in 1985.
1. What is a genogram?
In counseling, a genogram is a diagram used to assess family structure and relationship patterns. It is drawn around the client and covers at least three generations, up to the parents and grandparents. Unlike a genealogy, which records facts such as names, births, and deaths, it also puts emotional relationships and recurring events on the same page. Counselors use it in intake interviews, case conceptualization, and supervision.
A genogram is not a roster of who belongs to whose family; it is a map for reading what keeps repeating within a family. Three layers are drawn over one another on the same sheet. The first is the members and their legal and biological relationships (marriage, birth, adoption); the second is the layer of time (the years of births, deaths, marriages, divorces, migrations, and illnesses); and the third is the layer of emotional relationships (closeness, conflict, cutoff, distance).
Laying the three layers on one page turns facts that seemed scattered when heard in conversation into visible patterns. Connections such as the eldest son leaving home at an early age across three generations, or marital conflict recurring in every year that brought a loss, rarely come through in a verbatim transcript or case notes alone.
2. How is a genogram different from a family tree?
A genogram and a genealogy or family tree may look alike, but they serve different purposes. A family tree is a record of lineage; a genogram is a tool for clinical assessment. So while a family tree records the names, births, and deaths of as many generations as possible, a genogram covers at least three generations from the client and also captures emotional relationships, recurring events, and household boundaries. Genograms also differ in that their symbol system is documented in the literature and that they are read by clinical professionals such as counselors and supervisors.
| Aspect | Family tree (genealogy) | Genogram |
|---|---|---|
| Purpose | Preserving lineage and descent | Assessing family structure and relationship patterns |
| Scope | As many generations as possible | At least three generations from the client |
| What it records | Facts such as names, births, and deaths | Facts plus emotional relationships, recurring events, and household boundaries |
| Notation | Loose standards | Symbol system documented in the literature |
| Readers | Family and descendants | Clinical professionals such as counselors and supervisors |
3. What standard symbols does a genogram use?
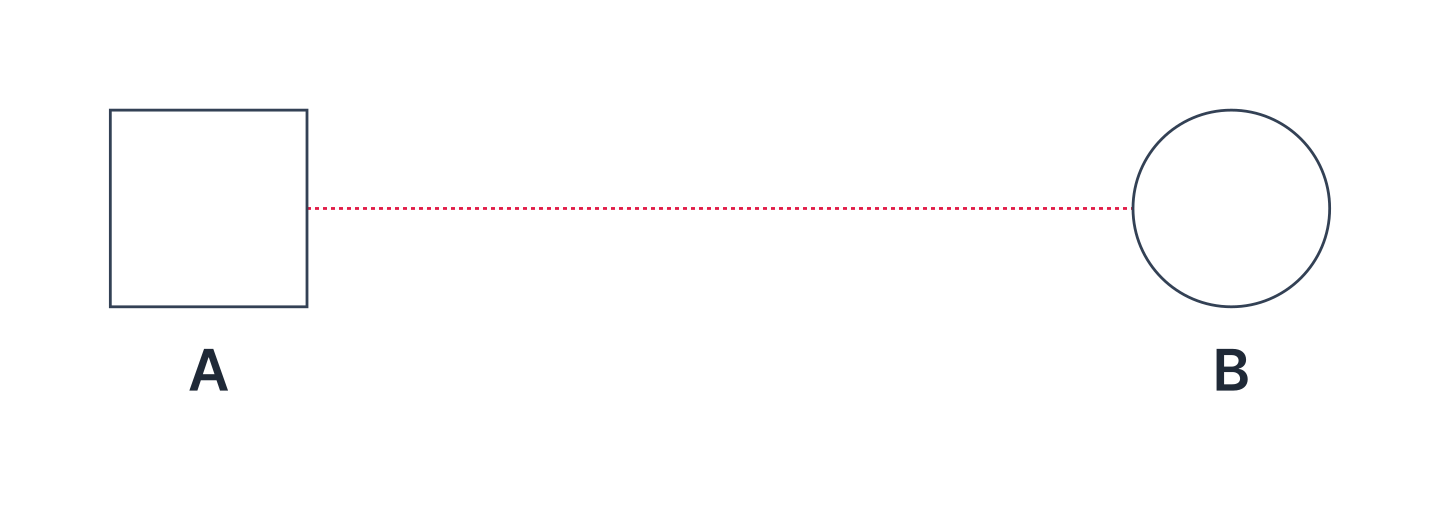
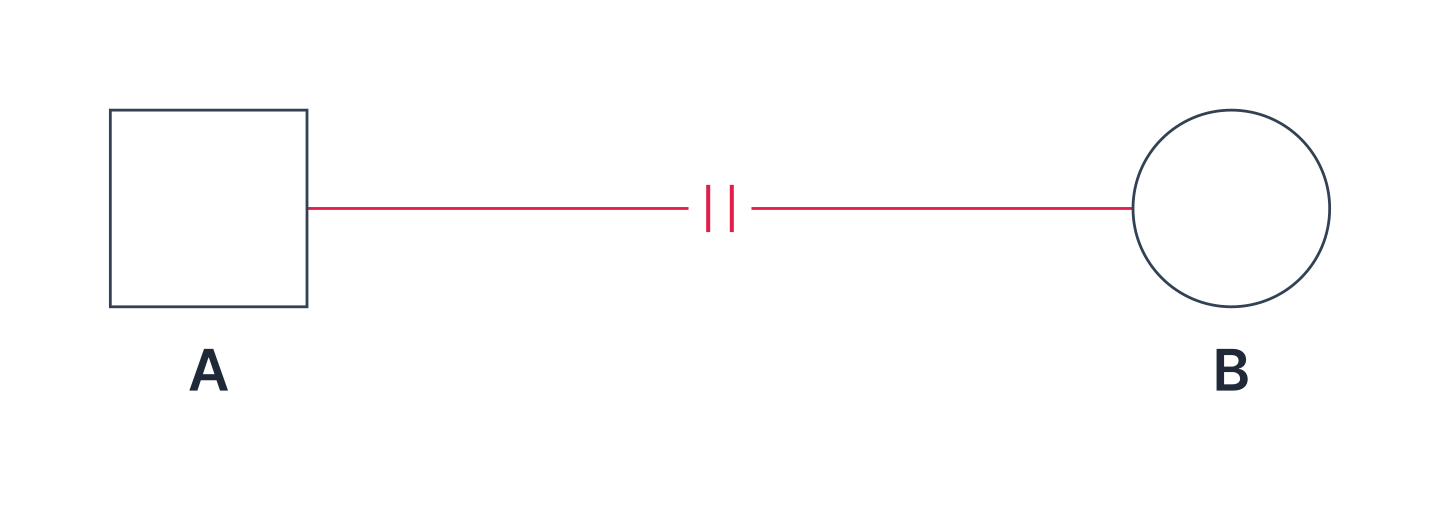
The standard genogram symbols are the notation set out in the work of McGoldrick, Gerson, and Petry, and they fall into three groups: persons, legal and biological relationship lines, and emotional relationship lines. For persons, males are drawn as squares and females as circles; the client is marked with a double line, and death with an X inside the shape. Marriage is joined with a solid line and living together or a common-law union with a dotted line; separation is marked with one slash across the relationship line and divorce with two, and children are joined by vertical lines dropping from the parents' relationship line. Emotional relationships such as closeness, conflict, and cutoff are shown as separate lines between persons. Details vary by edition and institution.
Each symbol image is what Auruda Genogram actually draws for that relationship. Click an image to enlarge it. All symbols on one chart (in Korean) →
3.1 How are persons shown?
In a genogram, males are drawn as squares, females as circles, and persons of unknown gender as diamonds. The client's shape is drawn with a double line, and a deceased person has an X drawn inside the shape, along with the year of death. A current pregnancy is shown as a triangle, and a pregnancy loss — miscarriage, abortion, or stillbirth — is recorded with a small symbol if it is clinically meaningful. Age goes inside the shape; name and years of birth and death go below it.
| Symbol | Item | Notation |
|---|---|---|
 | Male | Square |
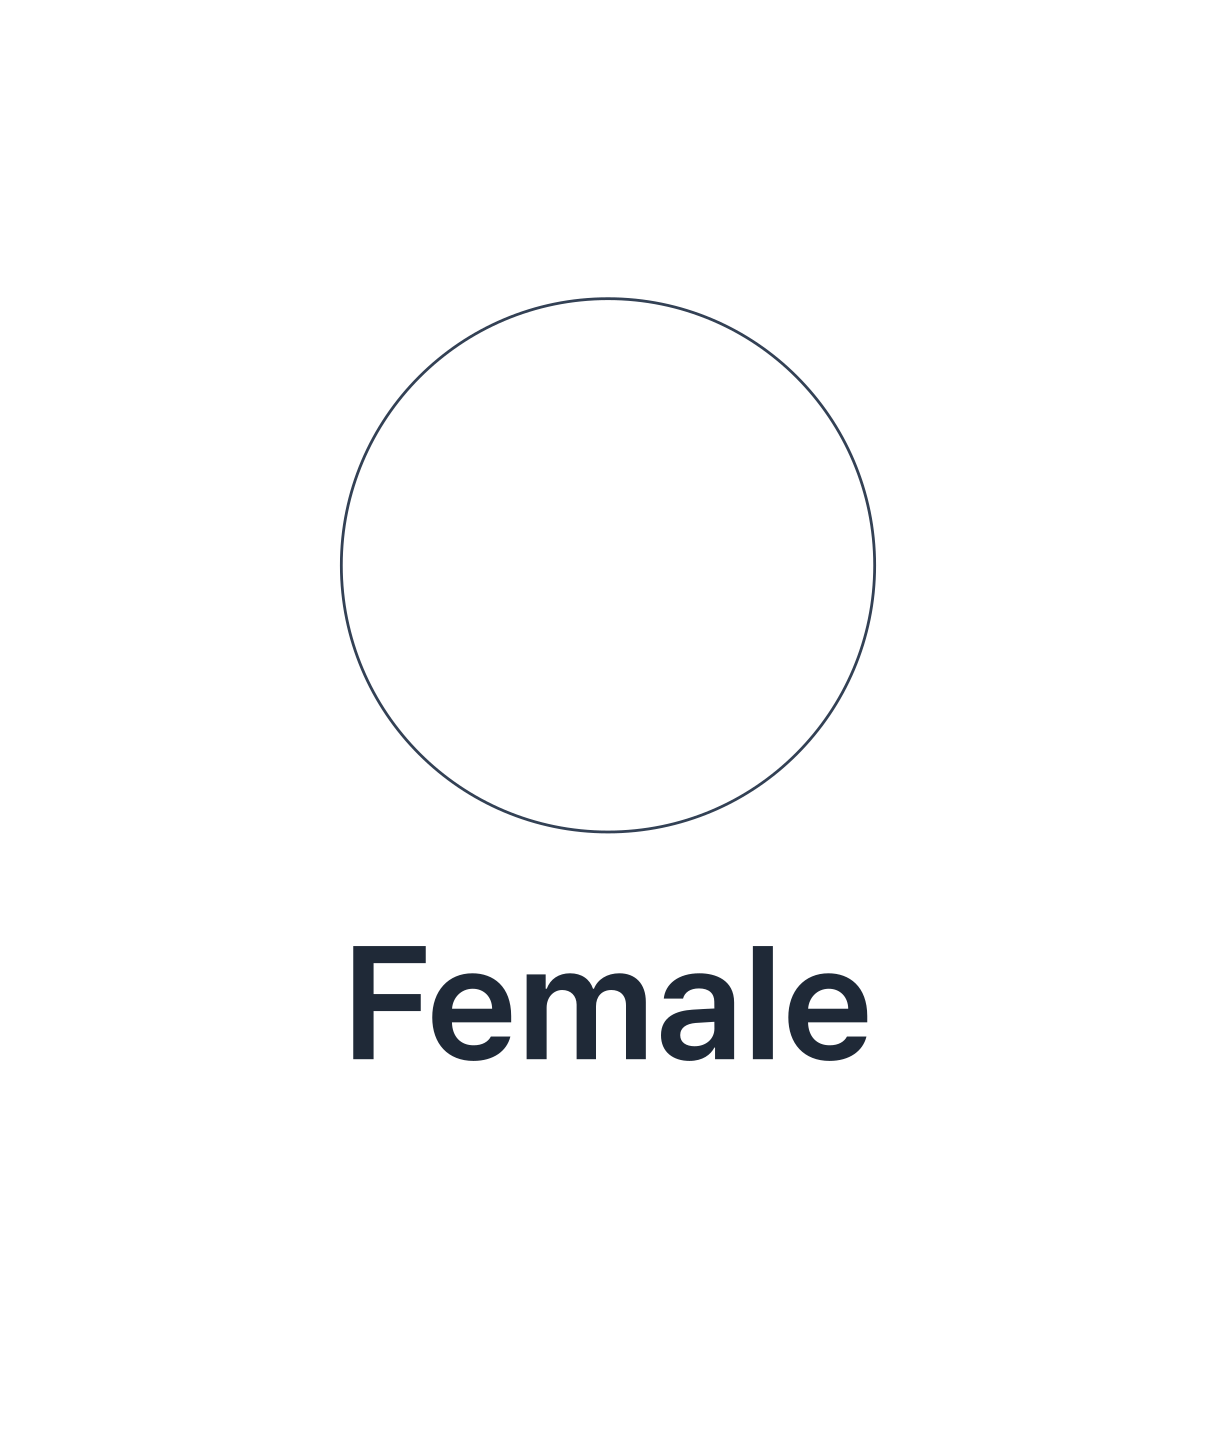 | Female | Circle |
 | Unknown gender / unknown person | Diamond (Auruda Genogram draws a question mark inside a dotted square) |
 | Client (index person, IP) | Shape drawn with a double line |
 | Death | X inside the shape, with the year of death |
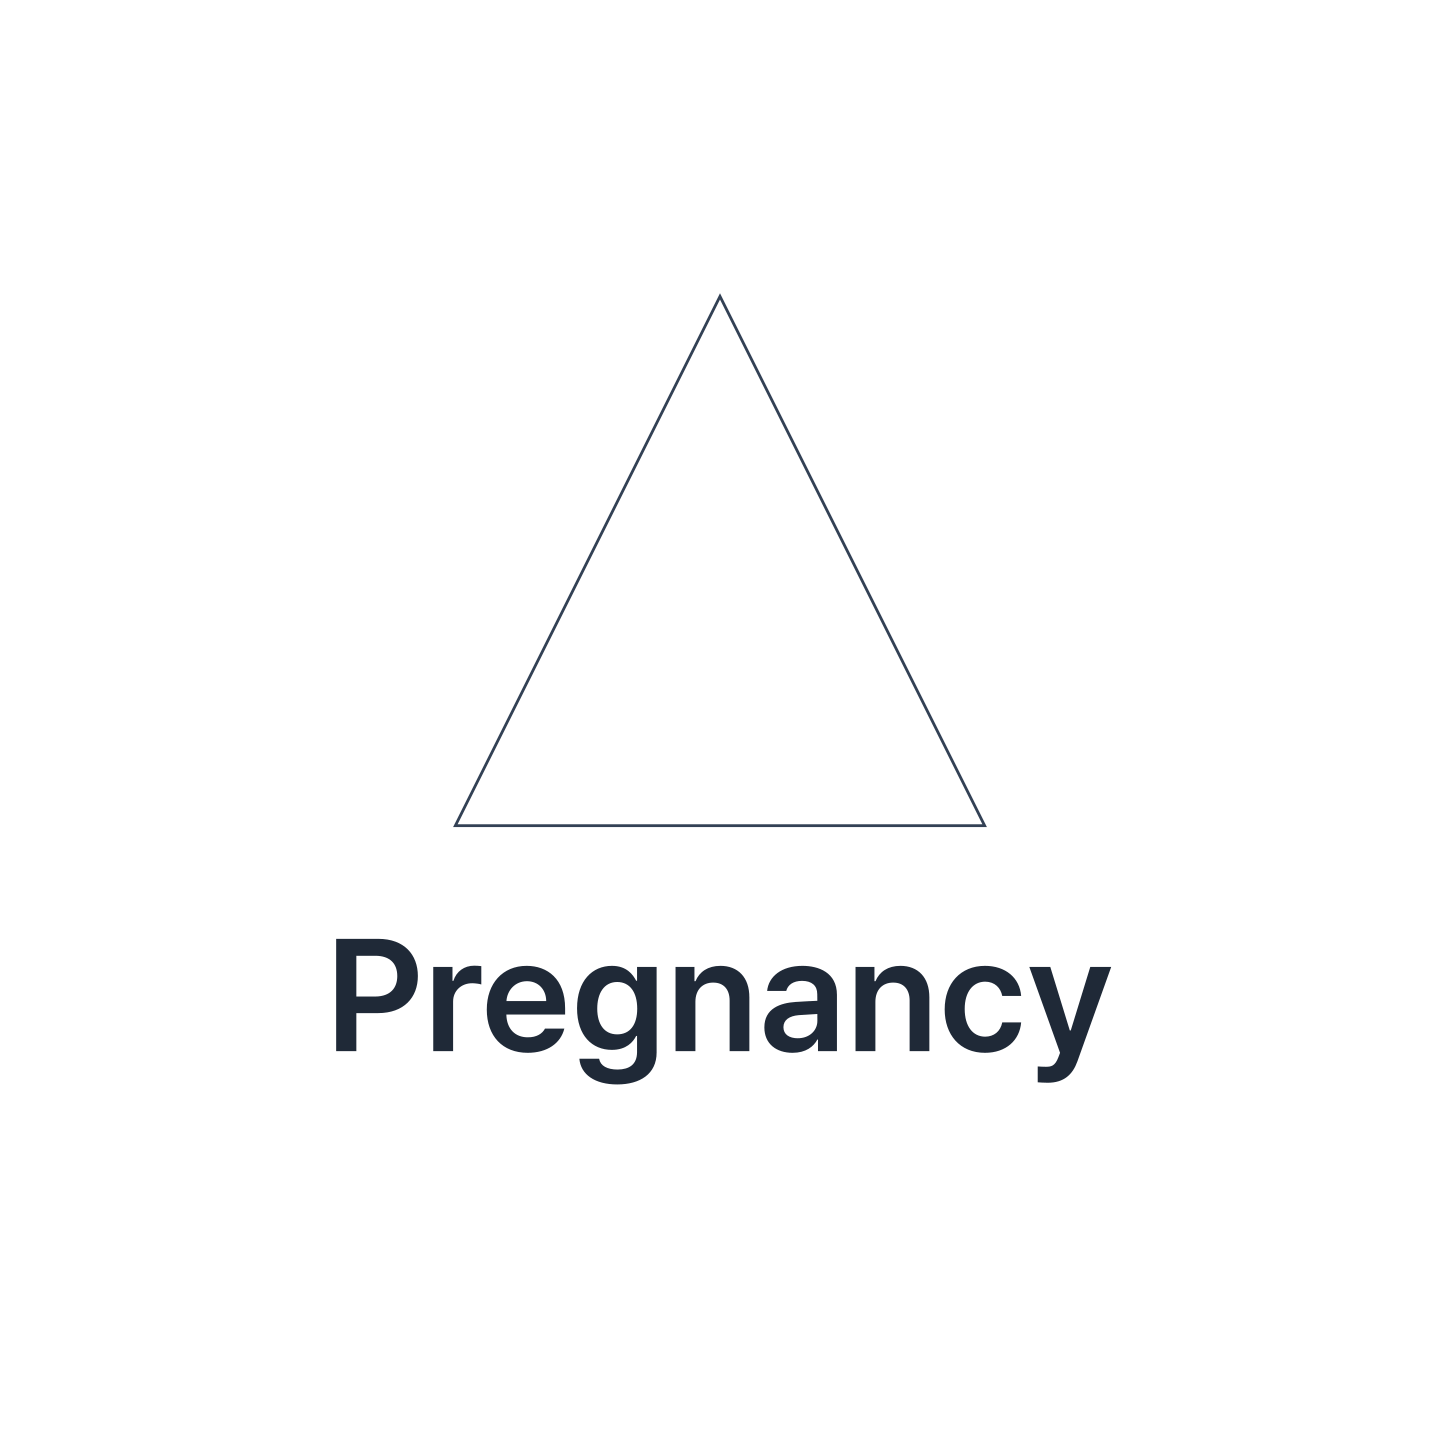 | Current pregnancy | Triangle |
 | Miscarriage (spontaneous abortion) | Small filled circle |
 | Induced abortion | Small X |
 | Stillbirth | Small gender shape with an X (Auruda Genogram uses a small square regardless of gender) |
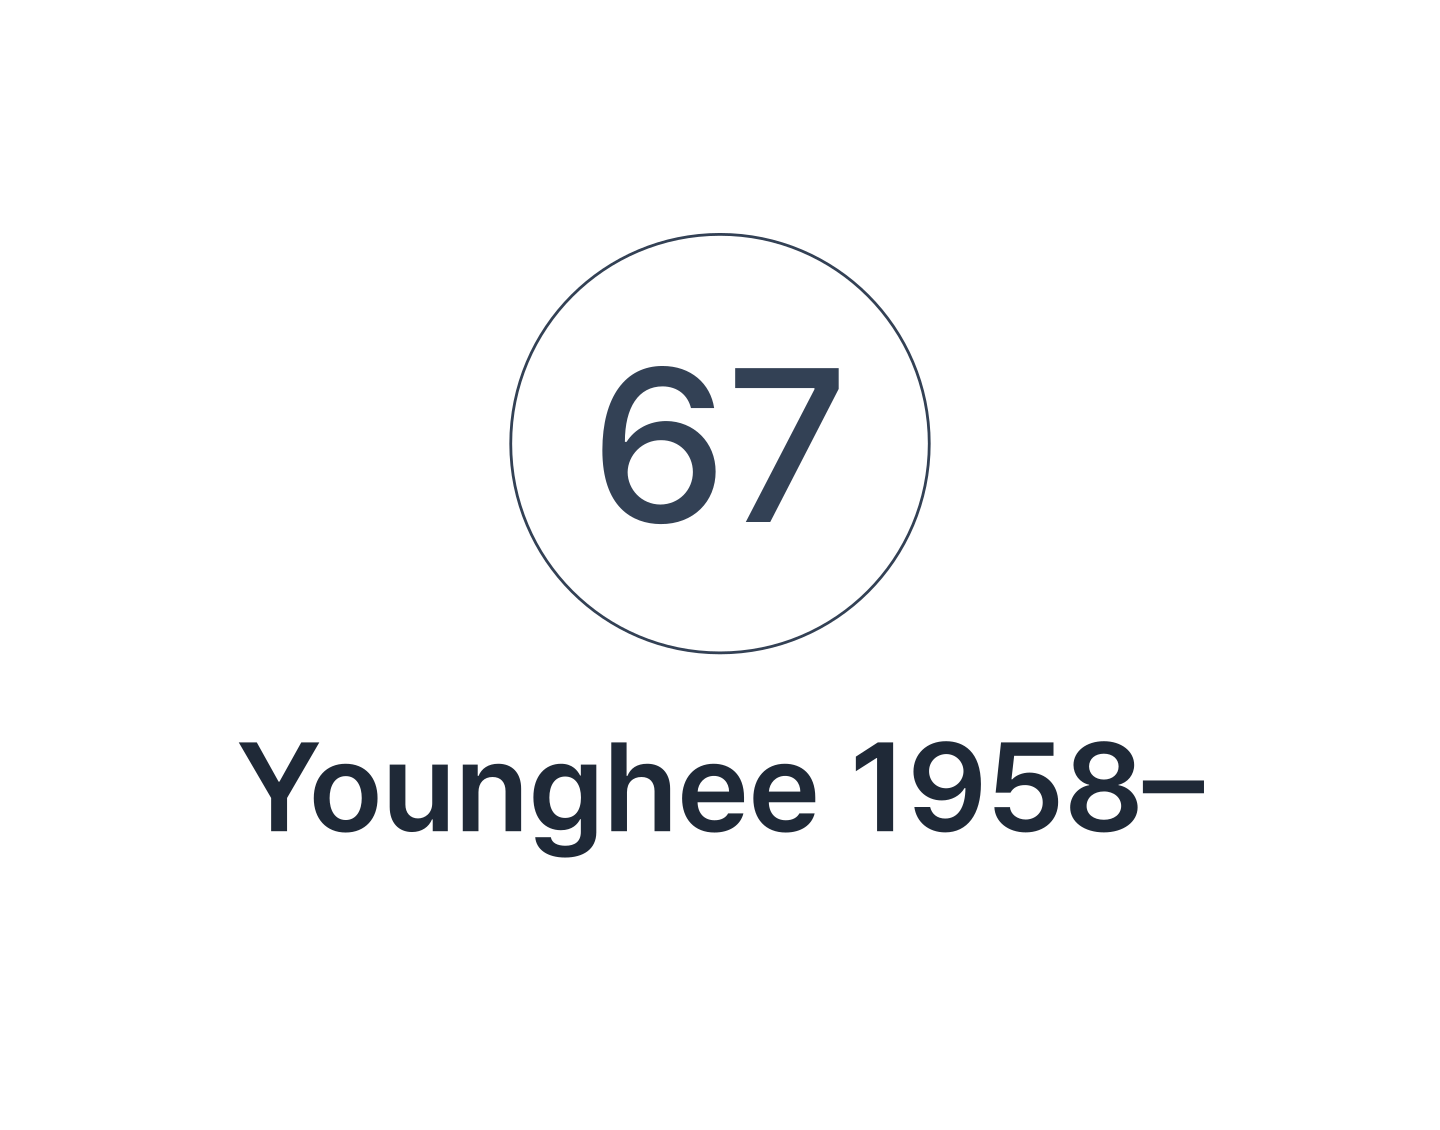 | Age, name, and years | Age inside the shape; name and years of birth and death below it |
3.2 How are legal and biological relationship lines drawn?
Marriage joins the two persons with a solid line marked with the year of marriage, and living together or a common-law union joins them with a dotted line. Separation is marked with one slash across the relationship line, and divorce with two. Children are joined by vertical lines dropping from the parents' relationship line and are placed oldest first from the left; adopted and foster children get dotted vertical lines, and twins are drawn with two lines branching from one point on the marriage line. Members of a household living together are enclosed in a dotted boundary.
| Symbol | Relationship | Notation |
|---|---|---|
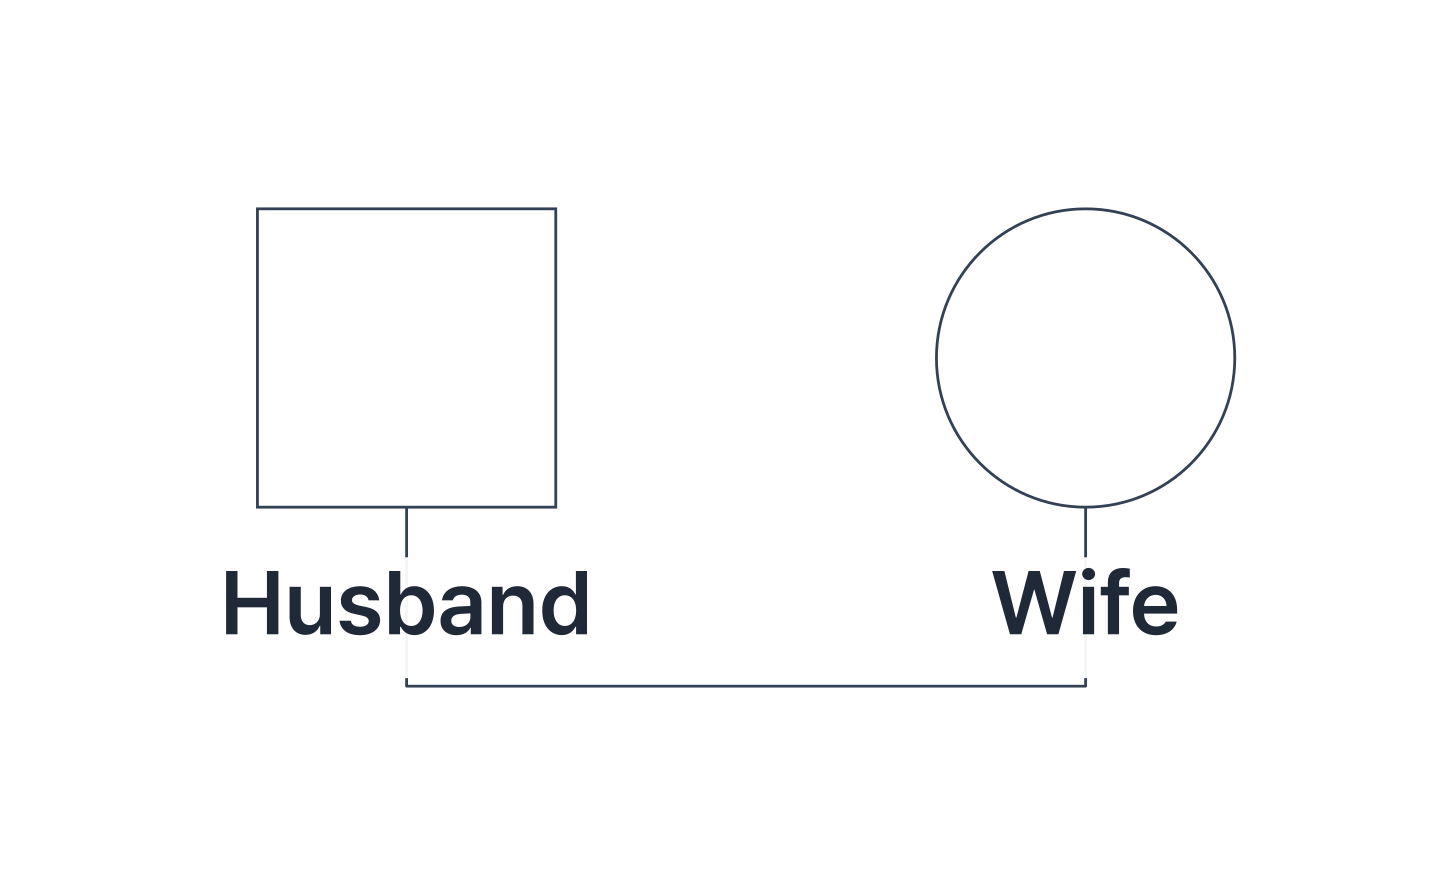 | Marriage | Solid line joining the two, with the year of marriage |
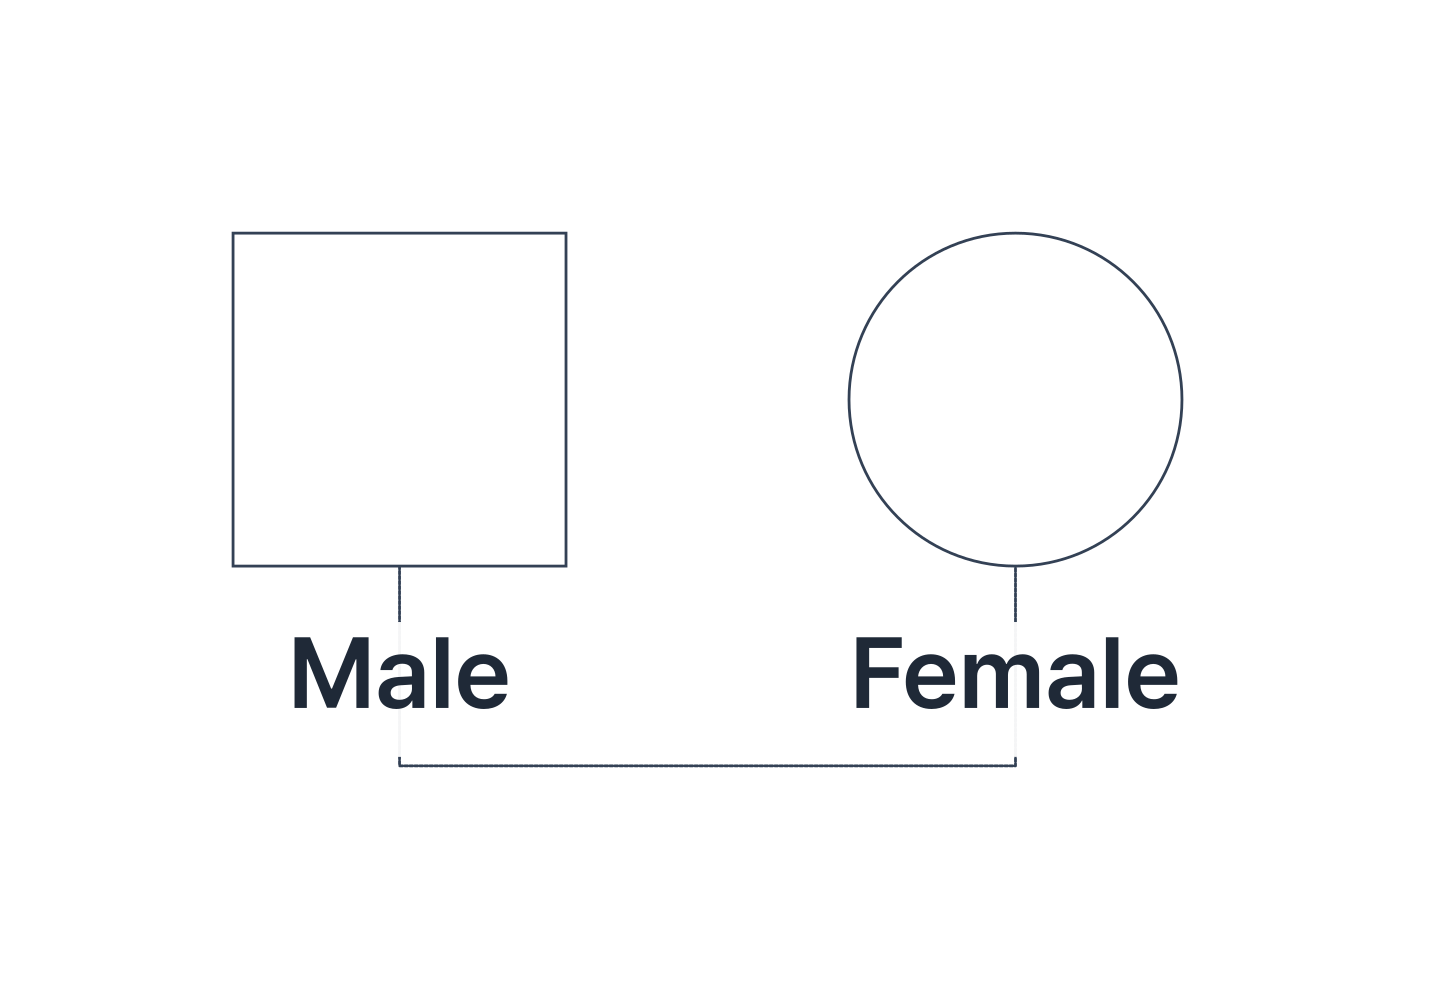 | Living together / common-law union | Dotted line |
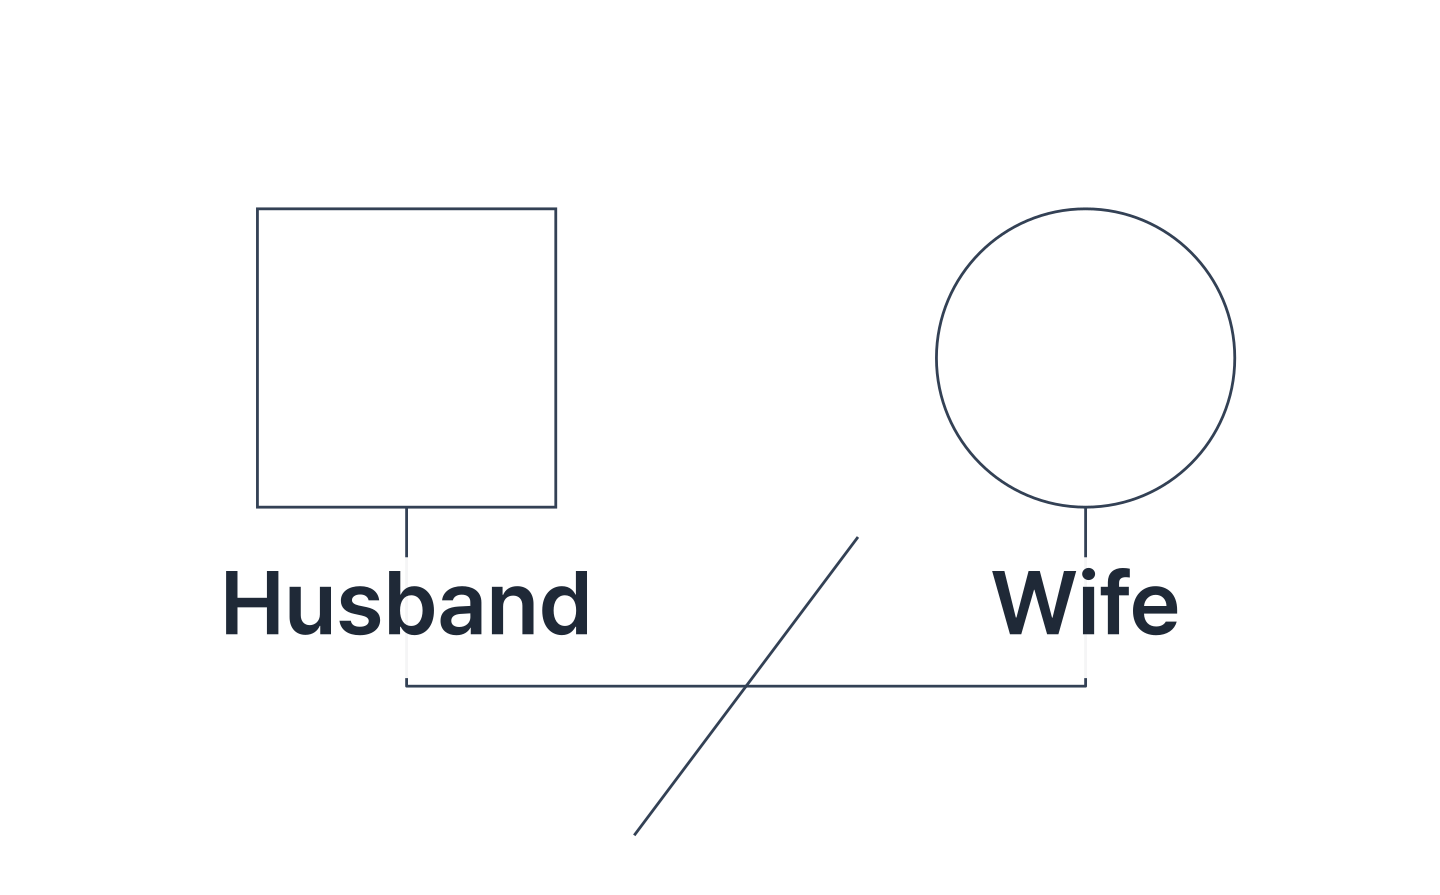 | Separation | One slash across the relationship line |
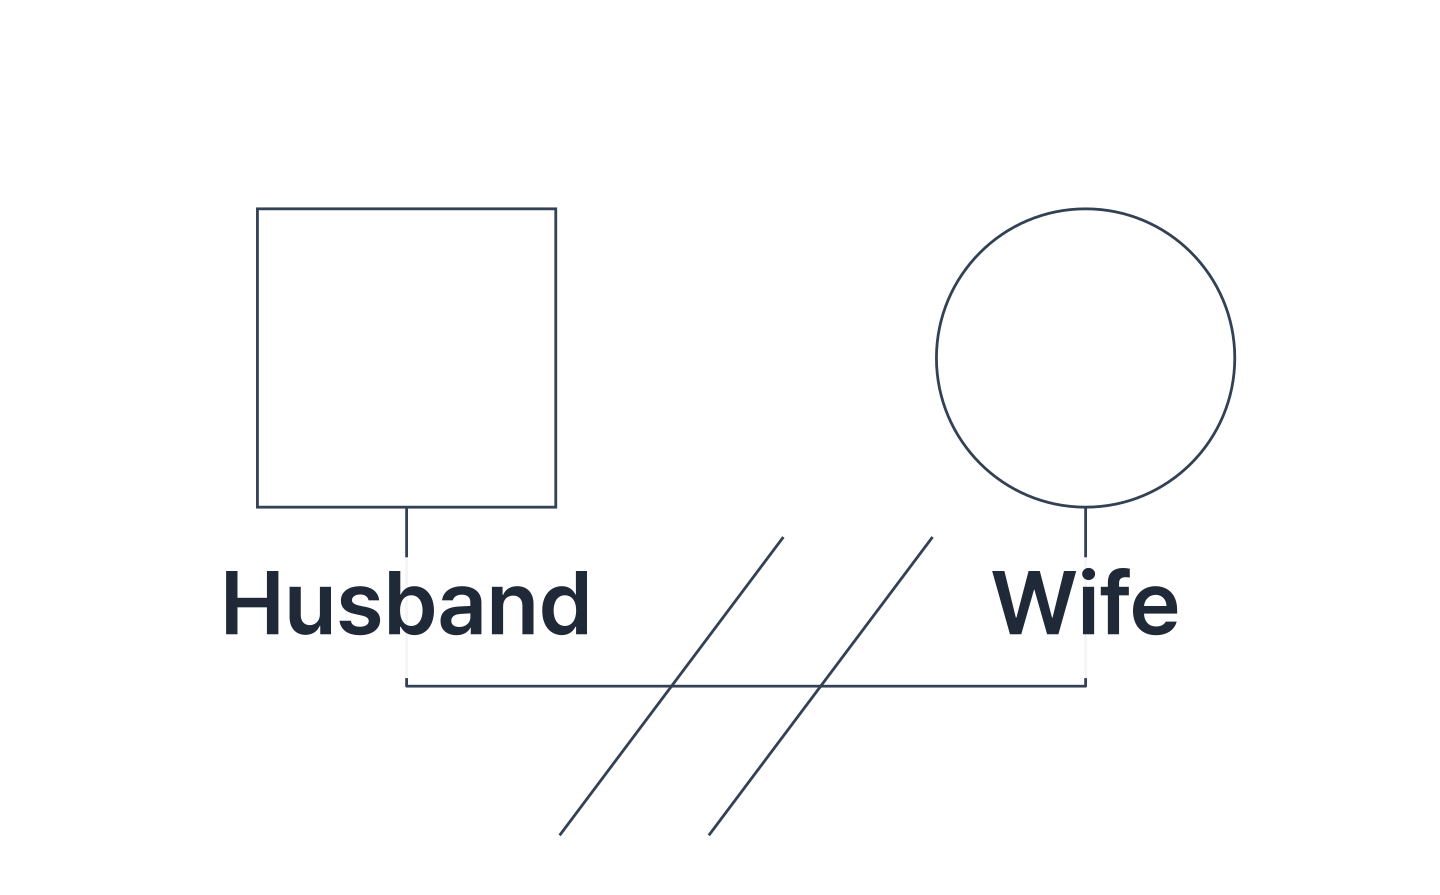 | Divorce | Two slashes across the relationship line |
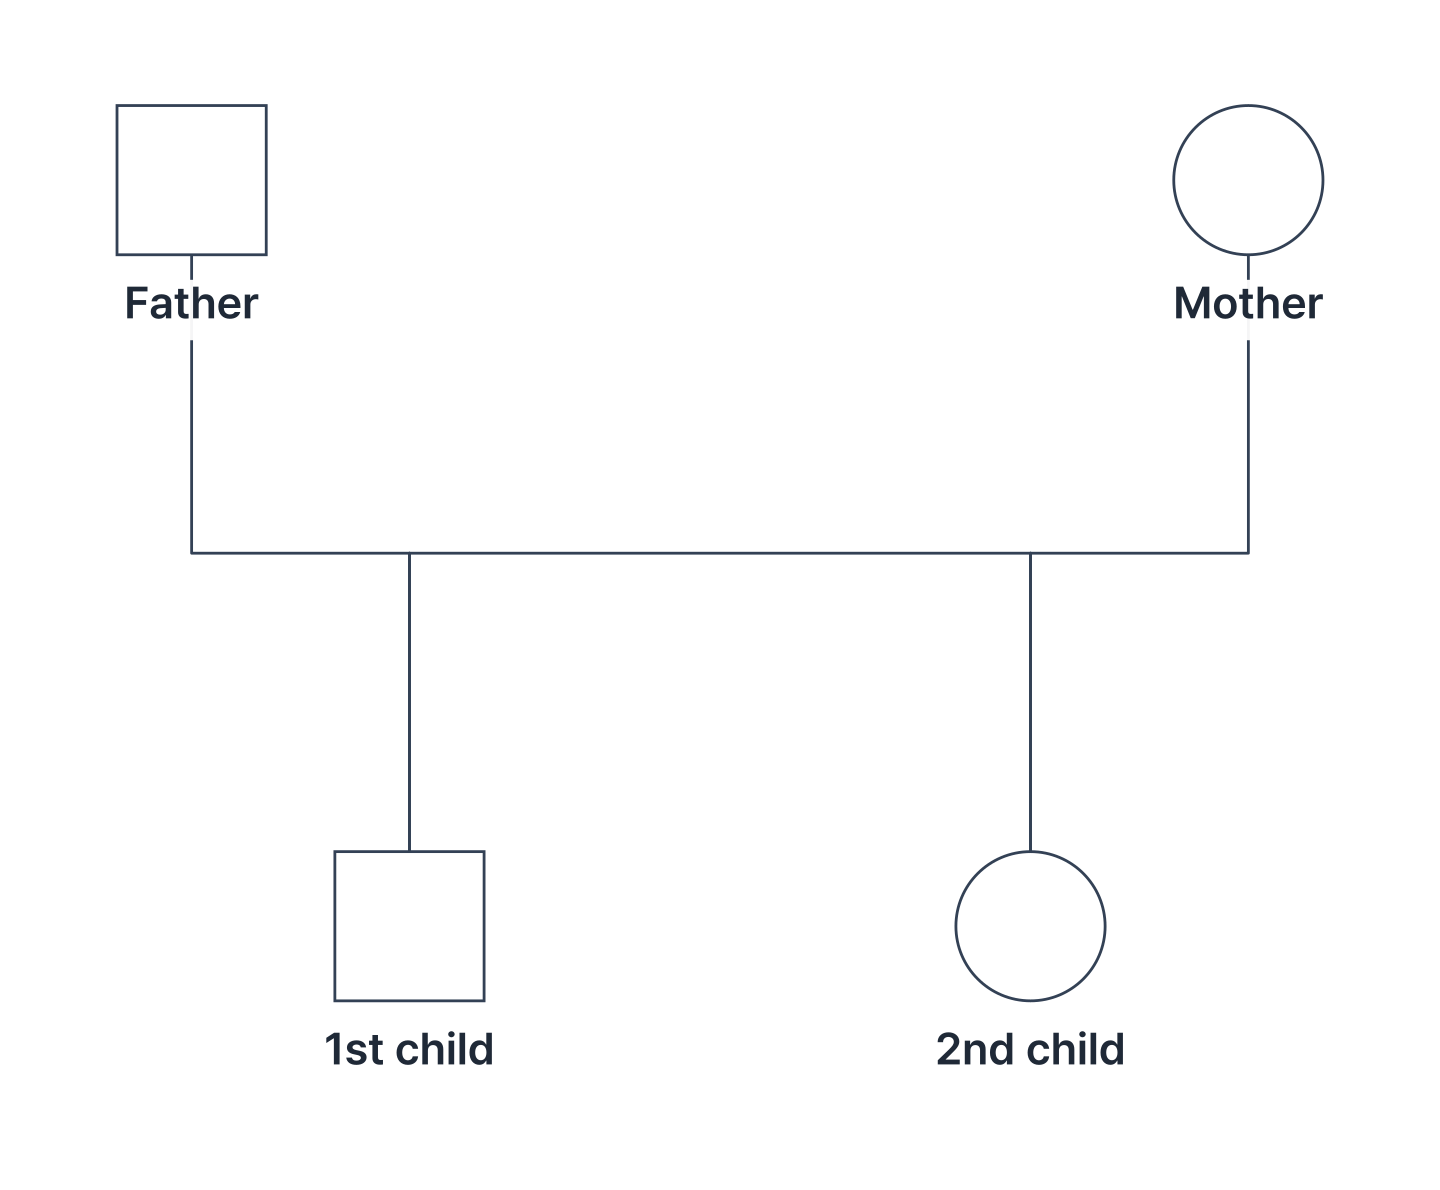 | Children | Vertical lines dropping from the parents' relationship line, oldest on the left |
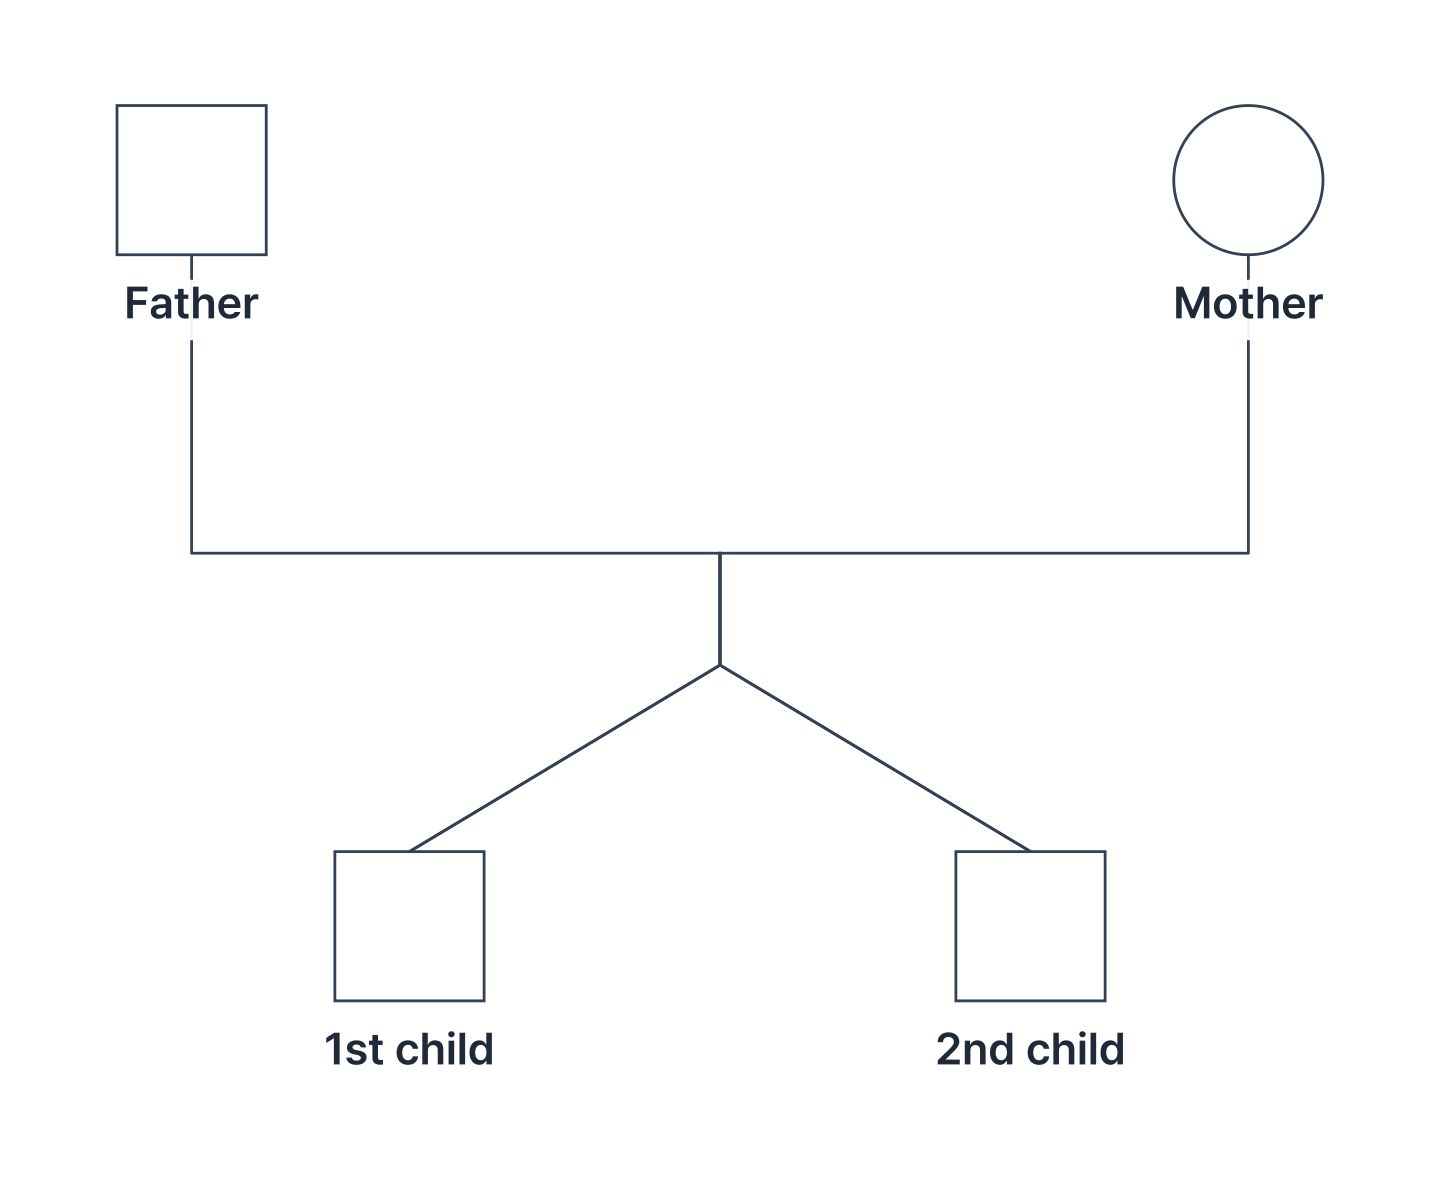 | Twins | Two lines branching from one point on the marriage line |
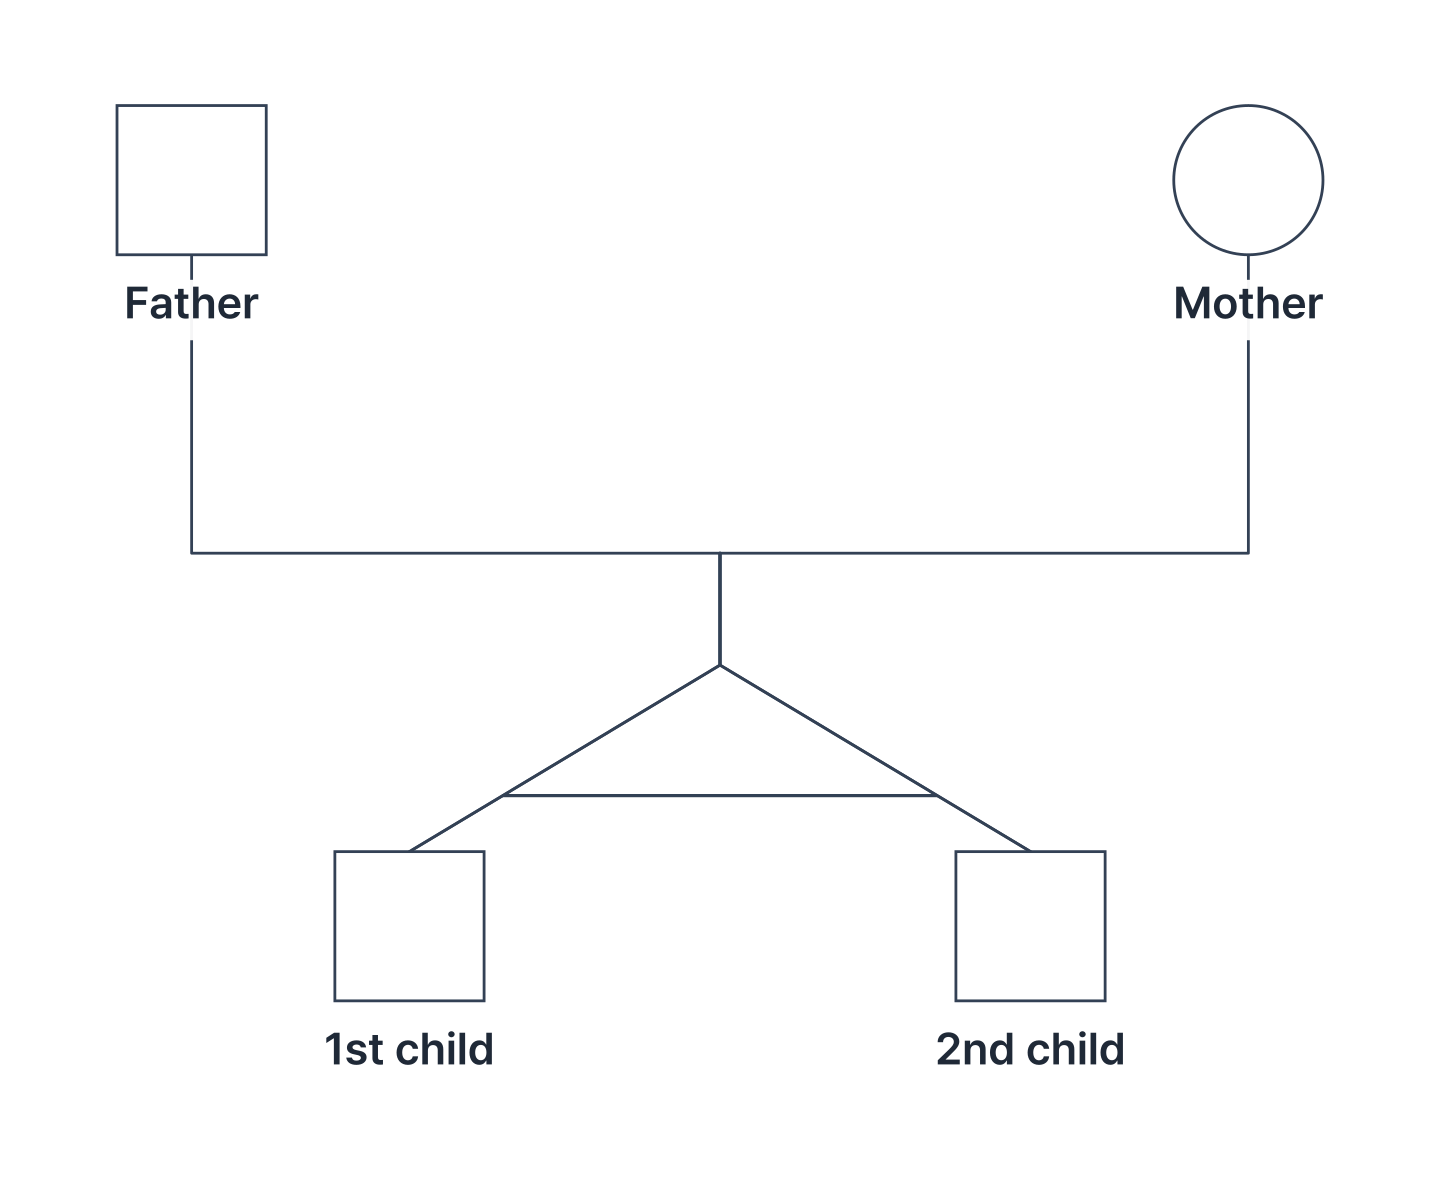 | Identical twins | A horizontal line joining the two branching lines |
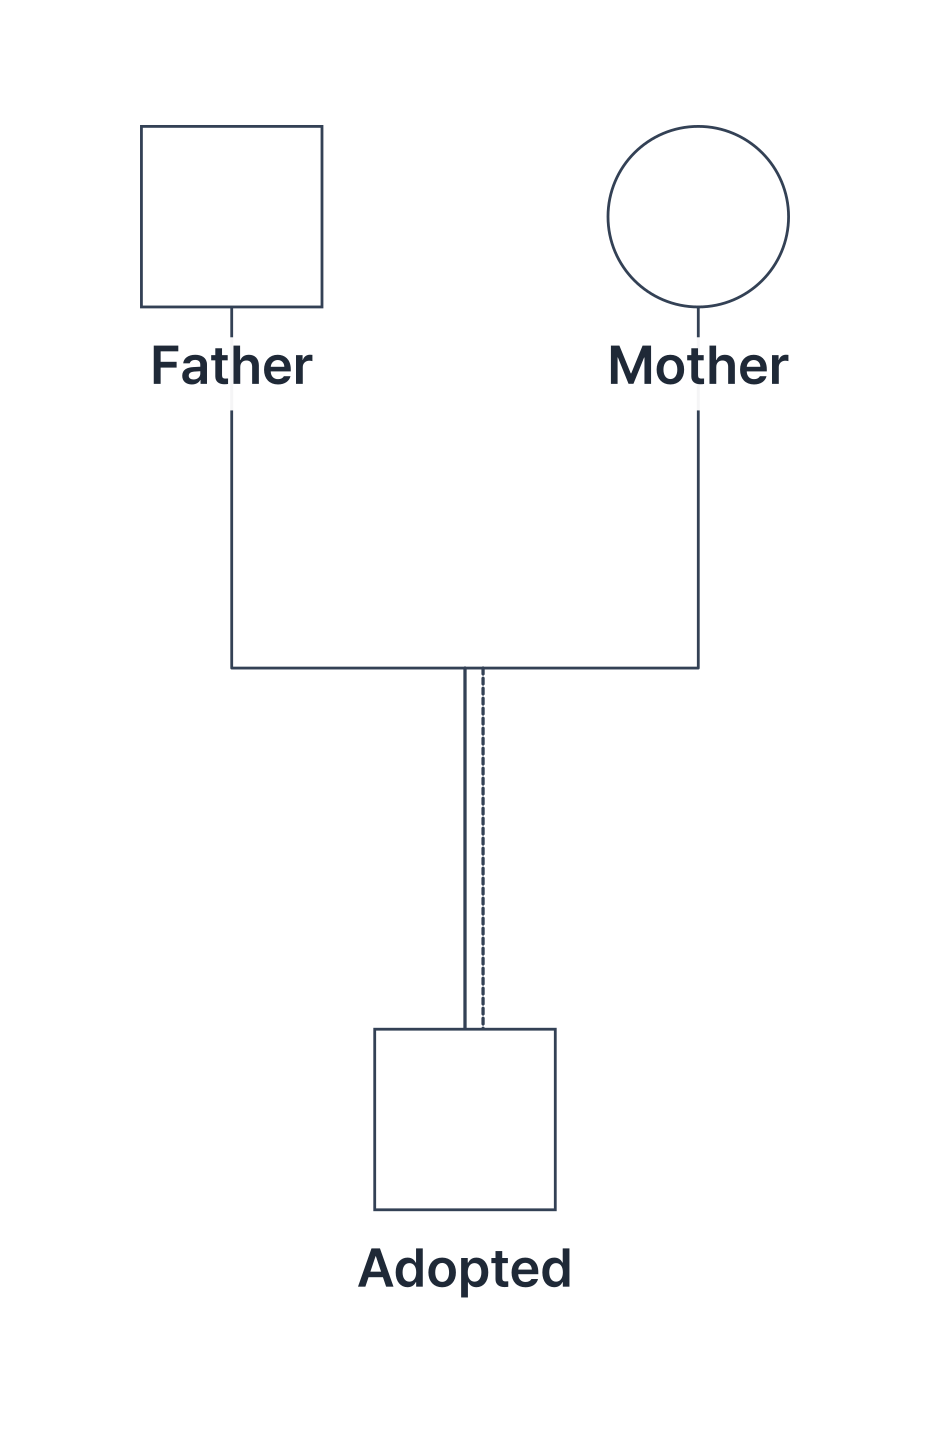 | Adoption | Dotted vertical line (Auruda Genogram draws a double line: solid plus dotted) |
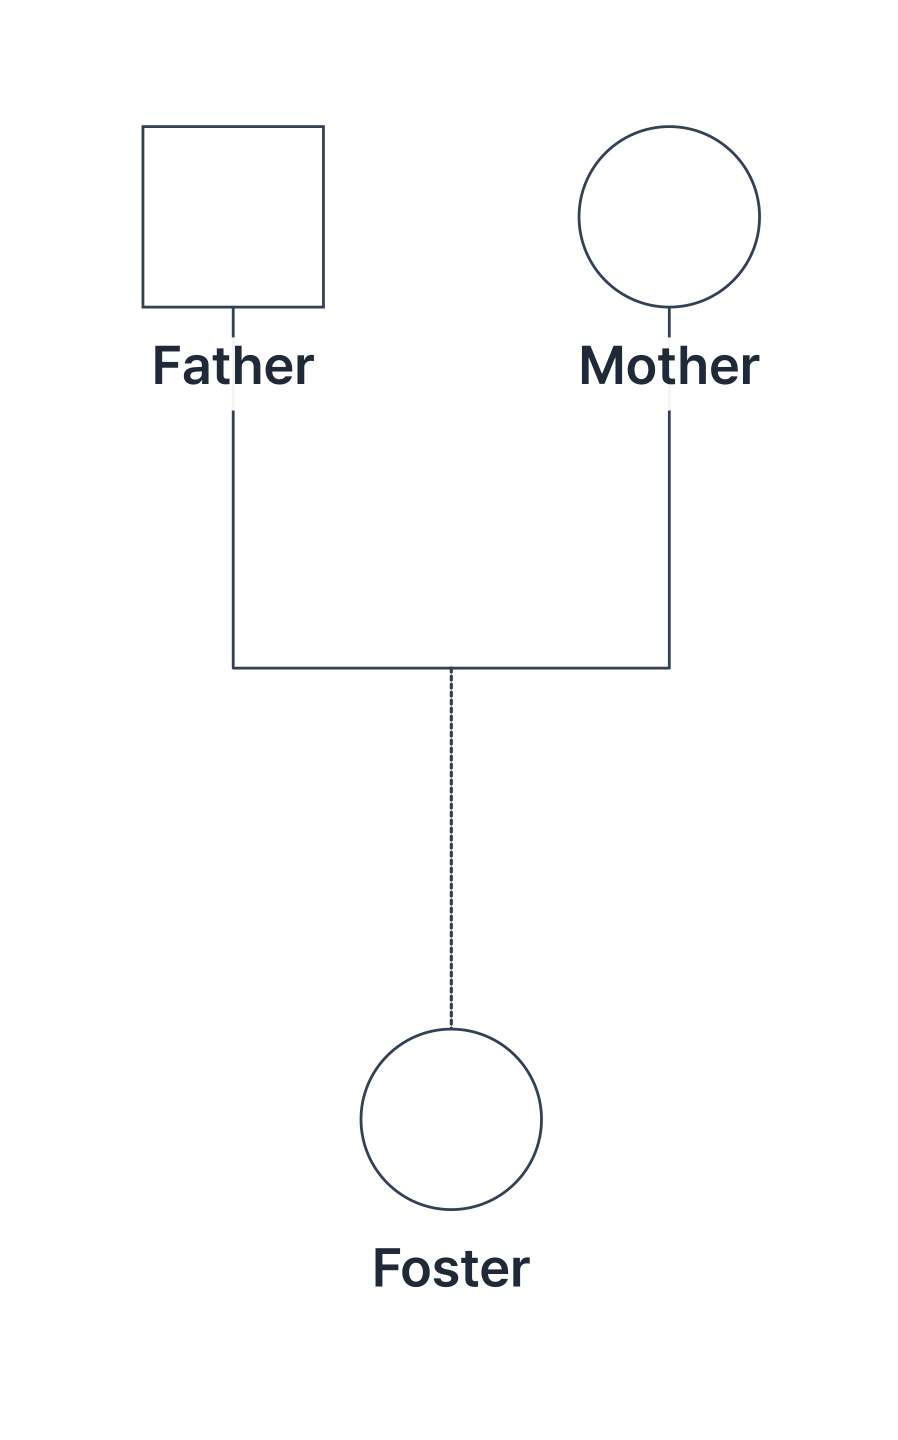 | Foster child | Dotted vertical line |
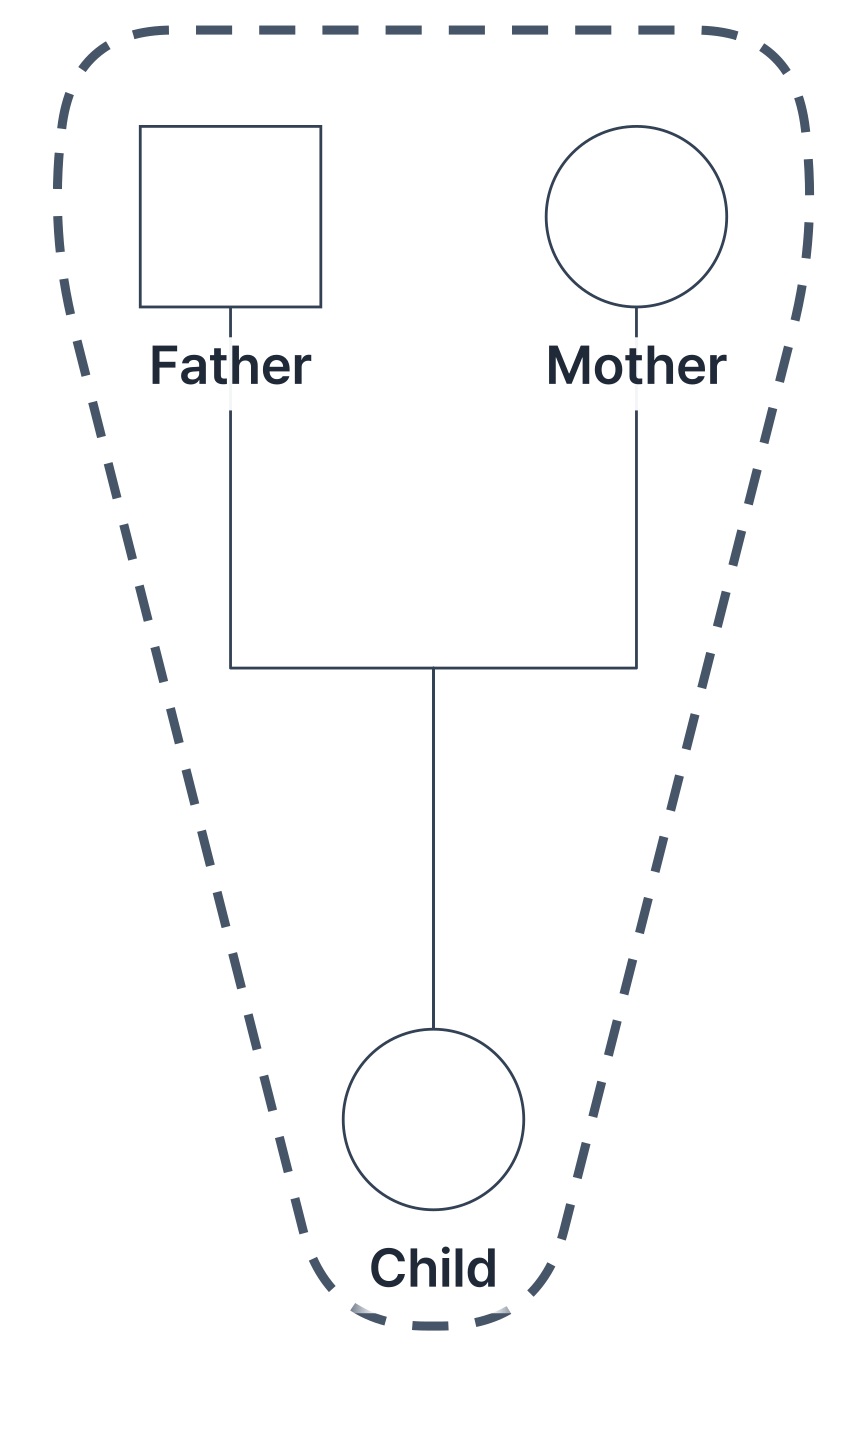 | Household living together | Members enclosed in a dotted boundary |
3.3 How are emotional relationship lines drawn?
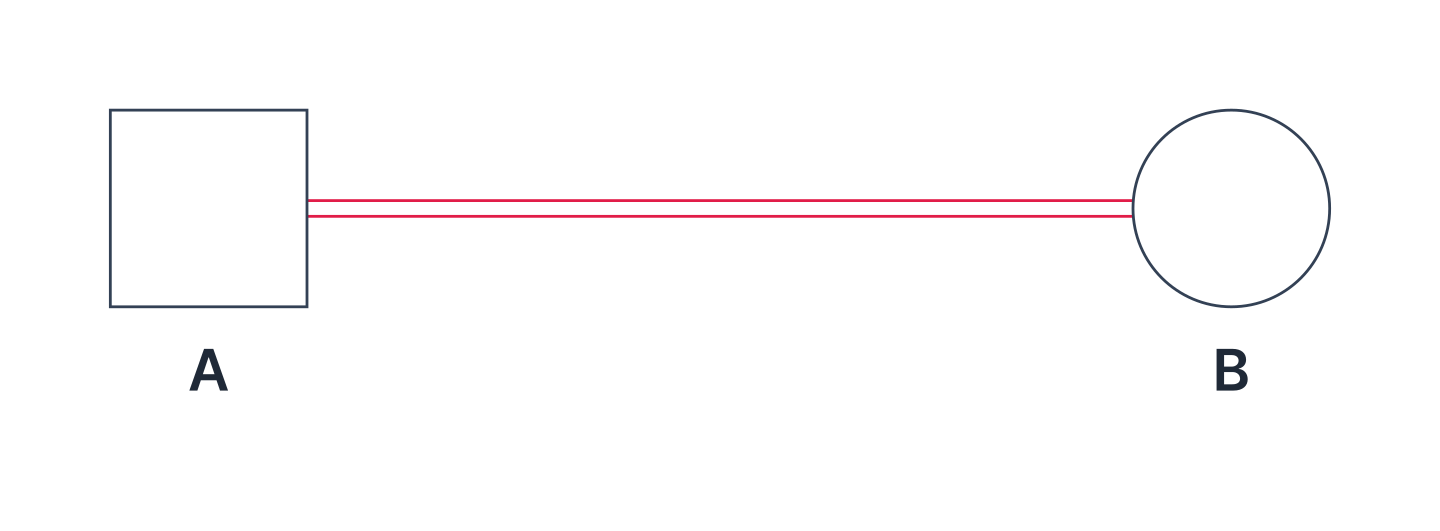
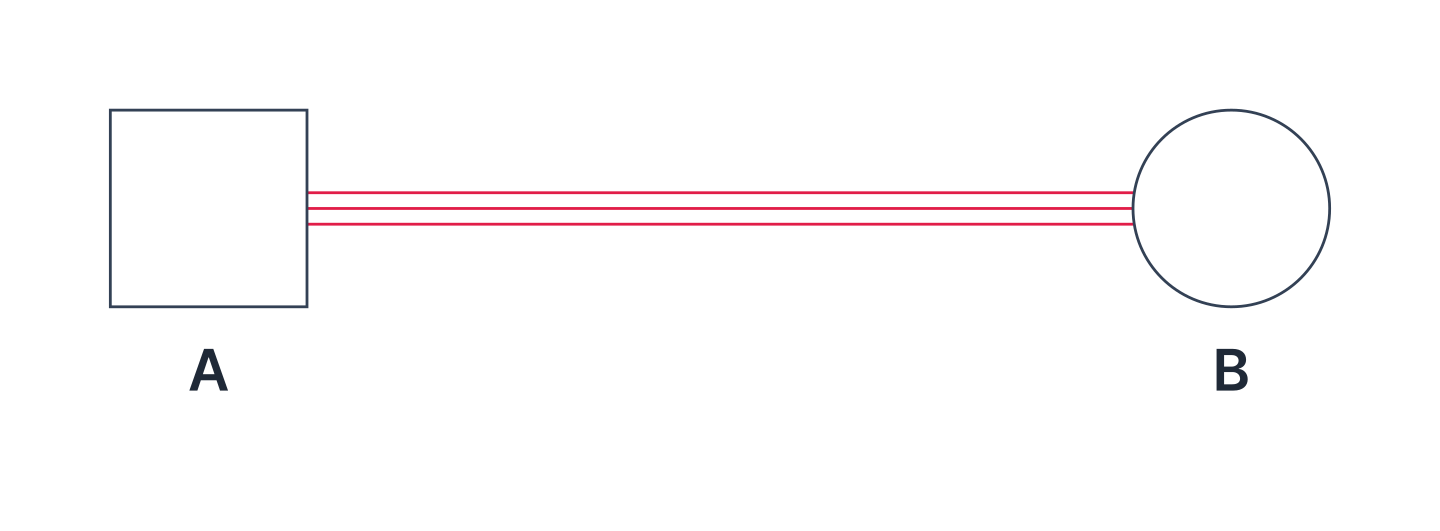
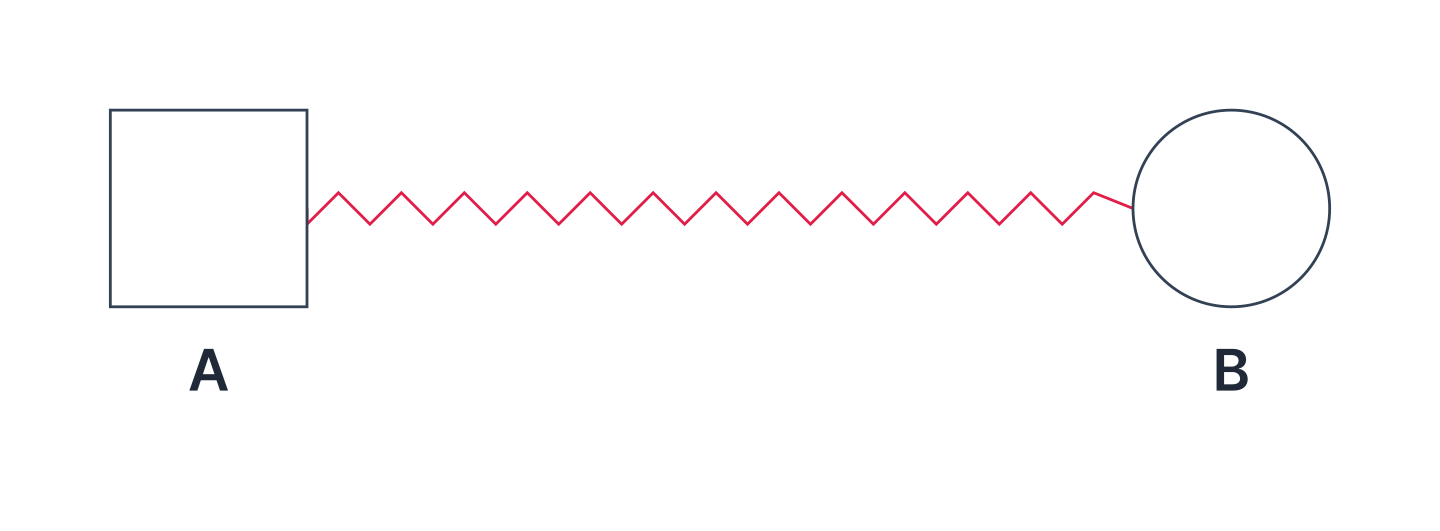
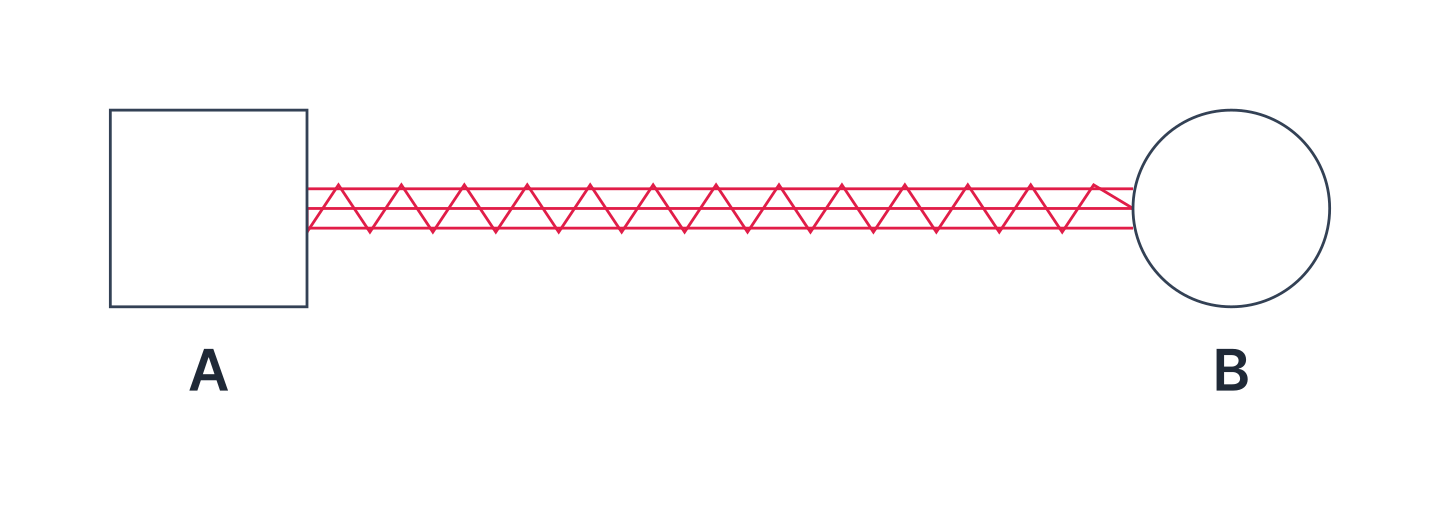
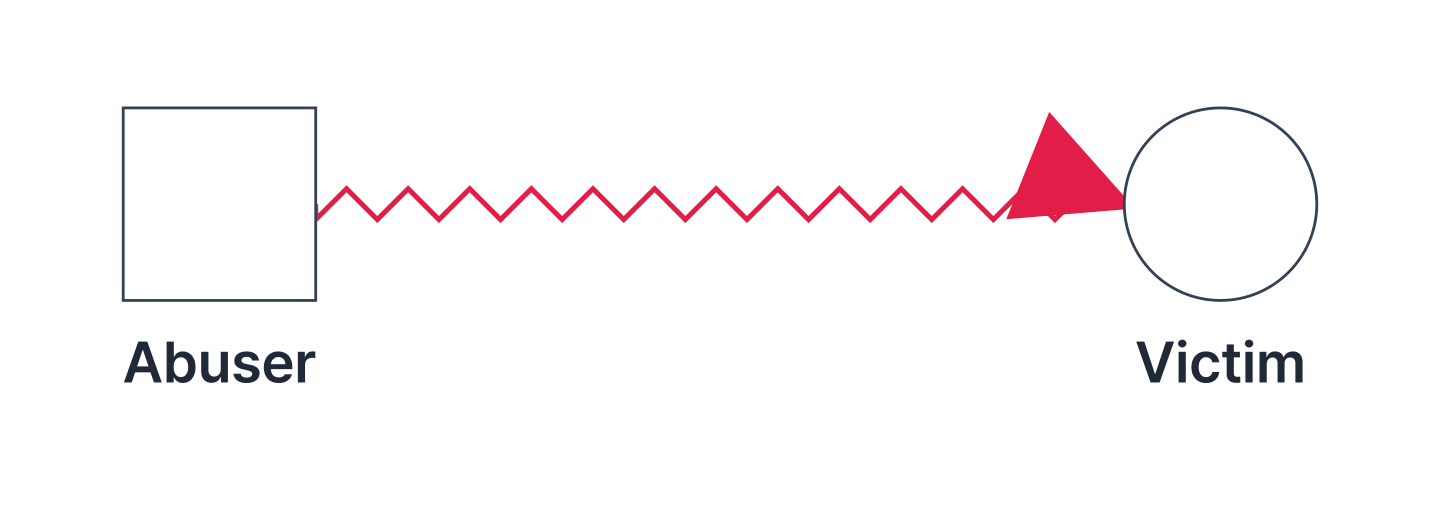
Emotional relationships are shown with separate lines drawn directly between persons. Commonly used categories are close, fused, conflictual (zigzag), fused and conflictual, distant, cutoff, and violence or abuse. Emotional relationship lines are the layer that carries the counselor's clinical judgment, so, unlike the factual layer, noting when the judgment was made lets you track relationships as they change over the course of sessions.
Emotional relationship lines in particular differ in color and shape across editions and institutions, so if your institution or professional association has guidelines, follow those first.
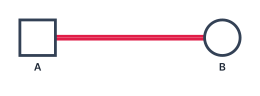 Close
Close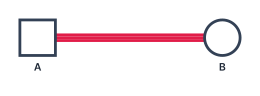 Fused
Fused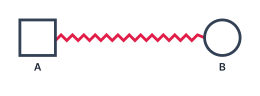 Conflictual
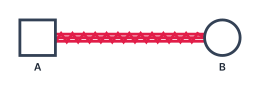 Fused and conflictual
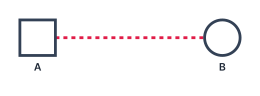 Distant
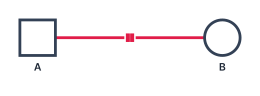 Cutoff
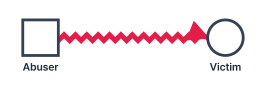 Abuse
Abuse
4. What are the three-generation rule and the layout rules?
Under the three-generation rule, a genogram shows at least three generations on one page: the client, the parents, and the grandparents. This is because repetition across generations only becomes visible with at least three. What sets a genogram apart from other diagrams is that its layout follows rules. Each generation sits on the same horizontal line, siblings stand oldest first from the left, a couple is joined by a single marriage line, and line crossings are kept to a minimum. Following these rules is what lets another counselor read the same diagram the same way.
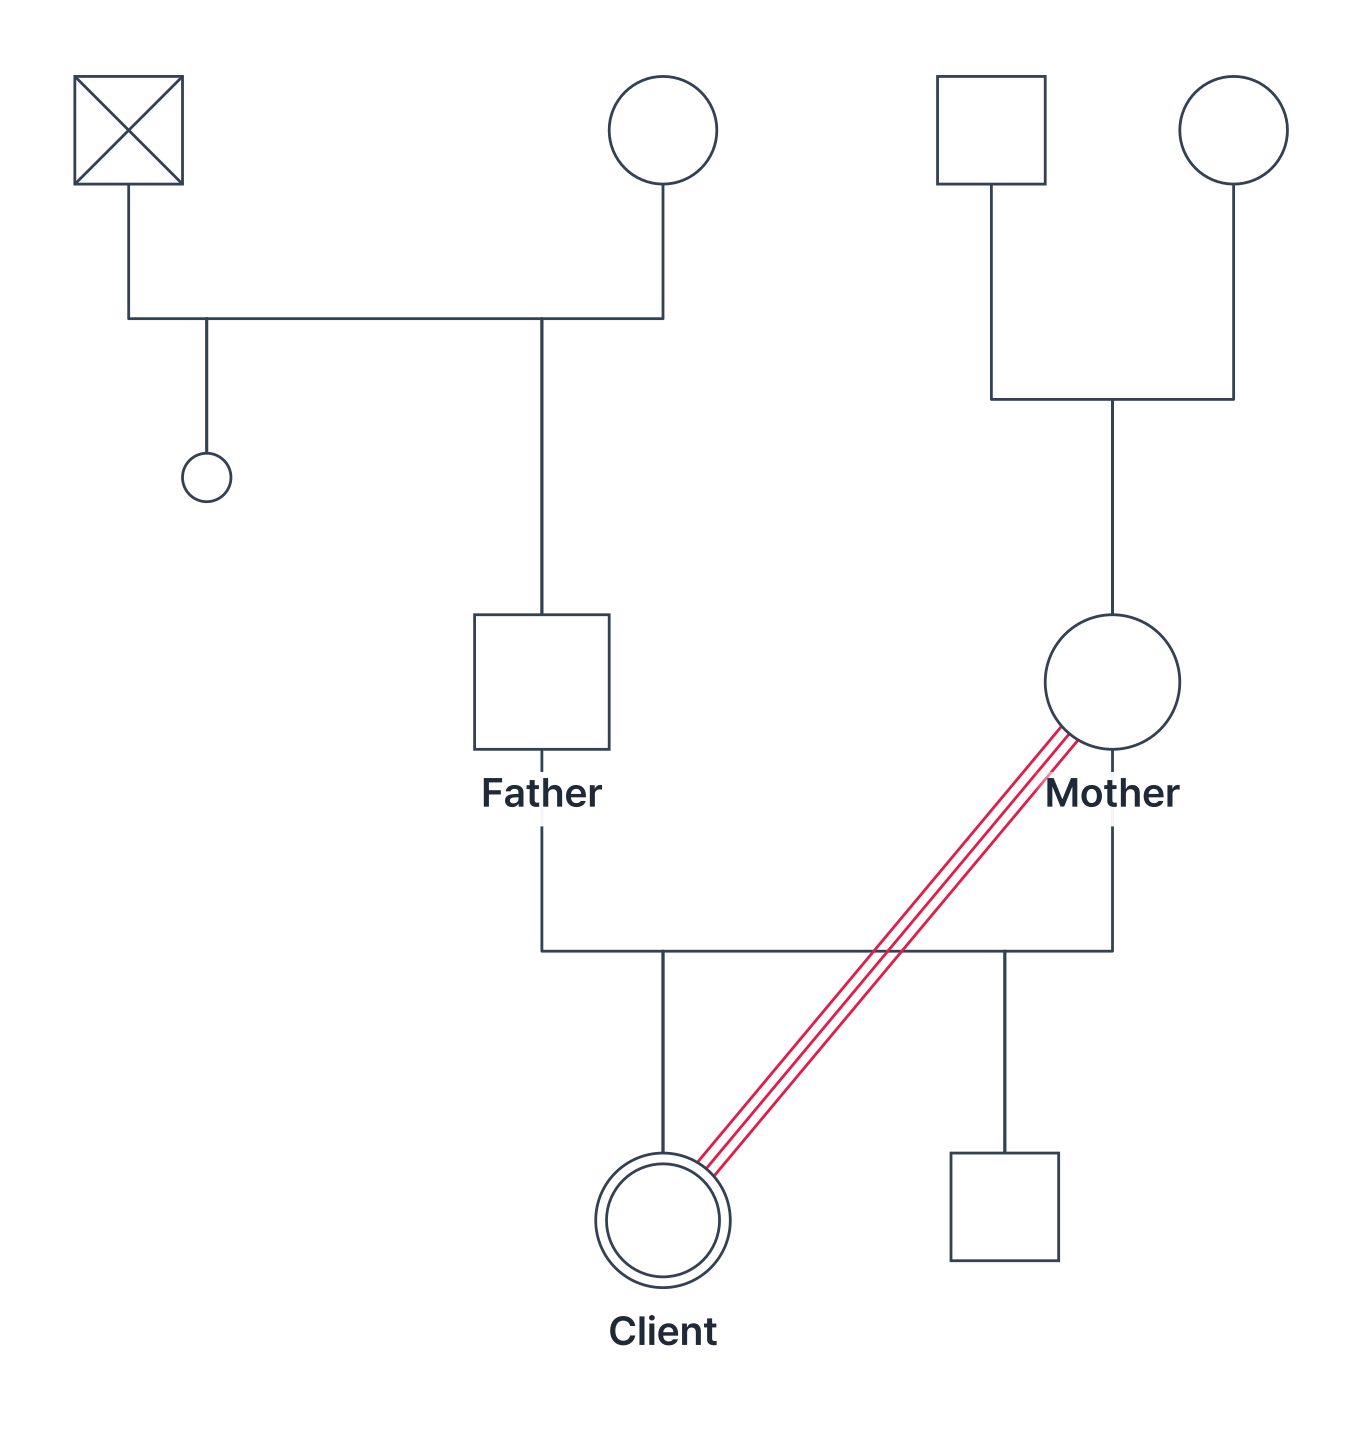
- At least three generations — the client, the parents, and the grandparents. Repetition across generations only becomes visible with at least three.
- Each generation on the same horizontal line — if generations are out of line, the generational structure of the whole diagram breaks down.
- Place siblings oldest first, starting from the left.
- Keep a couple together on one marriage line — both families of origin are raised above, on the couple's outer sides.
- If a person has more than one spouse, place them between the spouses, ordered left to right by when each marriage took place.
- Reduce line crossings — more crossings lead to misread relationships.
5. In what order is a genogram drawn?
A genogram is drawn in the following six steps. Set the scope at two generations above the client (and one below if needed), place persons by generation, then connect legal and biological relationships such as marriages, divorces, and child lines. Next, note events such as births, deaths, marriages, migrations, and illnesses with their years; add emotional relationships such as closeness, conflict, and cutoff together with when they were judged; and then mark household boundaries and check for recurring patterns.
- Set the scope. Two generations above the client, and one below if needed.
- Place persons by generation. The same generation at the same height, siblings oldest first.
- Connect legal and biological relationships. Marriage, living together, separation, divorce, and child lines.
- Note events and years. Births, deaths, marriages, divorces, migrations, illnesses, and losses.
- Add emotional relationships. Closeness, conflict, cutoff, and so on, with when each was judged.
- Mark household boundaries and check for patterns. Recurring triangles, cutoffs repeated in every generation, and periods when losses cluster.
6. How are genograms used in clinical practice?
A genogram is less a finished product than an interviewing tool. Drawing the family together in the intake interview gives the questions a natural order and gives the client enough distance to see their own family in the third person. In practice, it is used to structure intake interviews, for case conceptualization, as supervision material, and to track change between sessions, and it lets the presenting problem be seen within the repetitions of the family system rather than as a trait of the individual.
- Structuring the intake interview — it becomes a map of what to ask first.
- Case conceptualization — the presenting problem is seen within the repetitions of the family system rather than as a trait of the individual.
- Supervision material — faster than prose when a case has to be conveyed in a short time.
- Tracking change between sessions — relationship lines change as sessions progress, so noting the time turns them into a progress record in their own right.
7. How does Auruda Genogram follow the standard?
Auruda Genogram calculates the layout automatically as you enter persons and relationships. In doing so, it treats compliance with the standard as a hard constraint that comes before compactness or appearance. A layout that breaks the rules below is never adopted, even if it would make the diagram narrower or better looking.
- Each generation is placed at the same height (no splitting a generation or stacking it in tiers).
- Twins of the same couple must be adjacent, with no other person between them.
- A person with more than one spouse is placed between the spouses, ordered left to right by when each marriage took place.
- A couple is kept together on its marriage line, and both families of origin are raised above, on the outer sides.
- Nodes never overlap, and line crossings are reduced as far as the standard allows.
These rules do not just exist on paper; they are implemented as automated checks in the layout algorithm, and layout changes that fail the checks are not deployed.
That said, what the auto-layout produces is a draft. Clinical judgments, such as which relationships to treat as conflictual or which events to keep on the genogram, are not automated. Those judgments are left to the counselor; the tool only cuts the time spent redrawing.
Open the genogram maker →Practice with historical figures (in Korean) →See completed genogram examples (in Korean) →
8. Frequently asked questions
- How many generations should a genogram cover?
- The standard is at least three generations, including the two generations above the client (IP): parents and grandparents. You can draw more than three, but the more generations there are, the harder it becomes to read patterns on one page, so it is better to limit the scope to what the counseling purpose requires.
- When drawing a couple, must the male always be on the left?
- Placing the male on the left and the female on the right is not an absolute rule but a long-standing notational convention. Still, in counseling and supervision, where a counselor and a supervisor read the same genogram together, following the convention reduces misreading. When a person has two or more spouses, as in remarriage, the rule of placing the person between their spouses takes precedence over the convention.
- How do I show living together or a common-law union?
- A legal marriage is usually joined with a solid line, and a union that is not a legal marriage, such as living together or a common-law union, with a dotted line. Separation is marked with one slash across the relationship line, and divorce with two. Writing the years a relationship began and ended next to the line shows how it unfolded over time.
- How are adopted and foster children distinguished?
- Biological children are connected to the parents' relationship line with a solid vertical line, and adopted or foster children with a dotted vertical line. Auruda Genogram draws an adopted child line as a double line, adding a dotted line beside the solid one, to distinguish it from foster care. Sibling order follows birth order (oldest on the left), regardless of adoption or foster status.
- Are miscarriages, stillbirths, and abortions shown on a genogram?
- They are shown if they are clinically meaningful losses. Widely used conventions are a triangle for a current pregnancy, a small filled circle for a miscarriage, a small X for an induced abortion, and a small gender shape with an X for a stillbirth. These conventions vary by edition and institution, so follow your institution's guidelines if it has them.
- Is Auruda Genogram free? Where is client information stored?
- The genogram tool is free and works right in your browser, with no installation or sign-in. If you do not sign in, your work stays only on your device and is never sent to a server, and it is encrypted with AES-256-GCM when saved on the device. If you sign in, it is kept on the company's servers so you can continue on multiple devices, with the content and genogram names stored encrypted with AES-256-GCM. Details are in the Privacy Policy (in Korean).
9. References
- Bowen, M. (1978). Family Therapy in Clinical Practice. Jason Aronson.
- McGoldrick, M., & Gerson, R. (1985). Genograms in Family Assessment. W. W. Norton.
- McGoldrick, M., Gerson, R., & Petry, S. (2020). Genograms: Assessment and Treatment (4th ed.). W. W. Norton.
Symbol details vary by edition and institution. This document summarizes the notation commonly used across the works above; where your institution or professional association has guidelines, those take precedence.
Written by the Auruda editorial team · Last reviewed 2026-10-07 · This document does not replace clinical judgment. Contact contact@auruda-j.com